Party Bubbles and Exclusion - Westminster Twitter Analysis
Analysis of UK Parliament MPs' relations on Twitter, focusing on the numbers of ‘following’ and ‘followers’
Summary
In this project, I found evidence for the increase of popularity of Twitter among Westminster MPs, existence of party bubbles and lack of interest in MPs, who do not belong to the two biggest parties. For Twitter data collected between 19th December 2020 and 3rd January 2021, I found that the MPs from the UK’s three largest parties (Conservative, Labour and the Scottish National Party - SNP) exist on Twitter in their own party bubbles, with the problem being the most pronounced within the Conservative Party, where out of all the MP accounts followed by all Conservatives MPs, 92.14% are fellow Conservative MPs. Moreover, the data also showed that Conservative and Labour MPs, who accounted for 86% of all MPs present on Twitter at the time of data collection, display less interest in MPs, who represent Scottish or Northern Irish constituencies, or who do not belong to neither the Conservative nor Labour parties. SNP MPs account for 0.8% of all accounts followed by all Conservative MPs and 1.91% of all accounts followed by all Labour MPs. Whereas, out of the 16 MPs representing Northern Irish constituencies, 11 of those MPs are in the top 30 least followed MPs. These findings are concerning. The lack of interest from Conservative and Labour MPs in following SNP and Northern Irish MPs is worrying, considering the increasing number of pro-independence attitudes in both nations. Furthermore, the formation of party bubbles is dangerous for democracy as when MPs ‘close’ themselves in their party bubbles, they receive information from a reduced diversity of sources and the information is of lower quality, which creates an ideal environment for the erosion of civil discourse.
Analysis
My inspiration for this project came from reading James O’Malley’s twitter analyses of the UK parliament from April 2019 and January 2020, as well as Cath Sleeman’s Twitter network for UK MPs from April 2015.
Starting with the comparison to James' analyses, the first thing that is clearly visible is the increase in the popularity and usage of Twitter by the MPs.
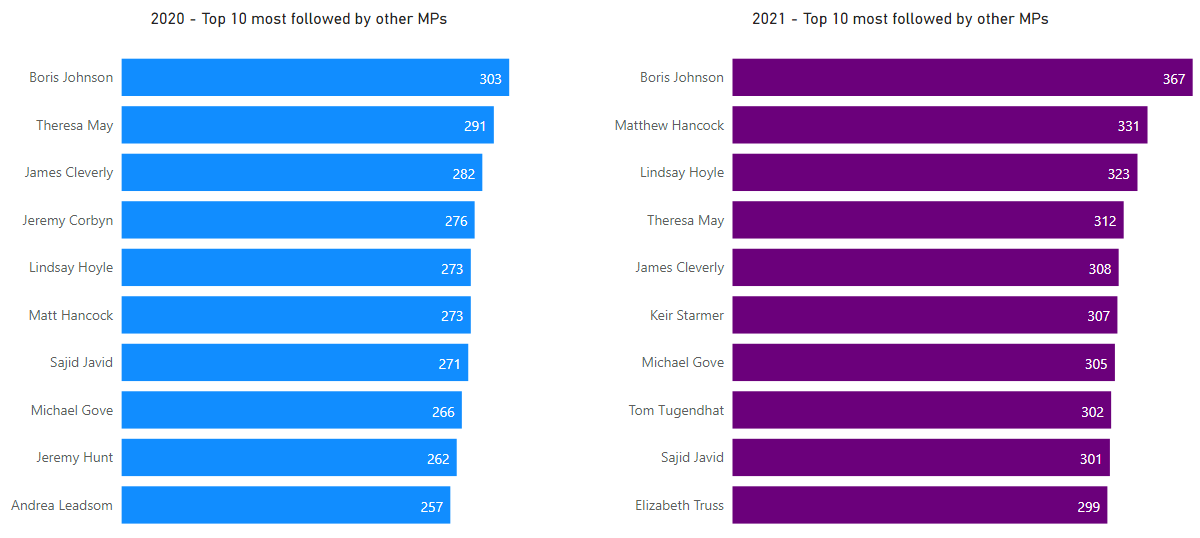
As we can see from the charts above, the MPs in the top 10 most followed by other MPs remained mostly unchanged, with 7 out of 10 MPs retaining their place. Only 3 new changes occurred. The new labour leader, Keir Starmer, replaced the former labour leader, Jeremy Corbyn. And Tom Tugendhat and Elizabeth Truss replaced Jeremy Hunt and Andrea Leadsom. However, what is striking is the increase in the number of MP followers. Looking at the top 3, in a span of a year, Boris Johnson increased his MP follower count by 64, Matthew Hancock increased his by 58 and Lindsay Hoyle increased his by 50. Moreover, if we treat the top 10 rankings from 2020 and 2021 as 2 separate groups, the top 10 group from 2020 had an average follower count of 275.4, whereas the top 10 group from 2021 had an average follower count of 315.4. This leads to an increase of 40.1 followers, which highlights the increased importance and popularity of Twitter as a tool among Westminster MPs. It is probable that the effects of the Covid pandemic and working digitally were major contributing factors in the increase.
The second thing that stands out is the dominance of the Conservative MPs in the Westminster Twittersphere.
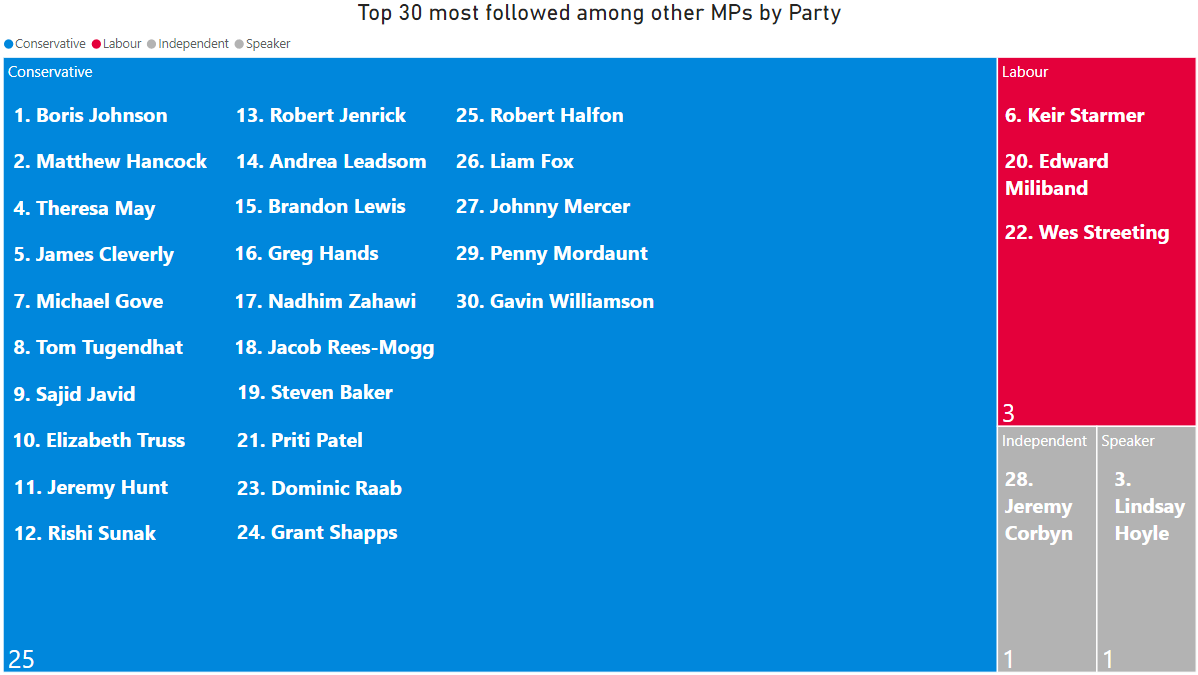
Looking at the treemap above, we see just how much more influence the Conservative party and its MPs have in the Westminster Twittersphere, with 83% of MPs in the top 30 most followed MPs among other MPs being from the Conservative Party, compared to just 10% being from the Labour party. It is possible to try to explain this situation by highlighting the fact that the Conservative Party is the party in power, meaning that more of its MPs are in positions of power, and thus MPs from all across the political spectrum inevitably take more interest in what the Conservative MPs say on Twitter.
Or, we can try to explain this by looking at the absolute numbers of MPs present on Twitter from each party.
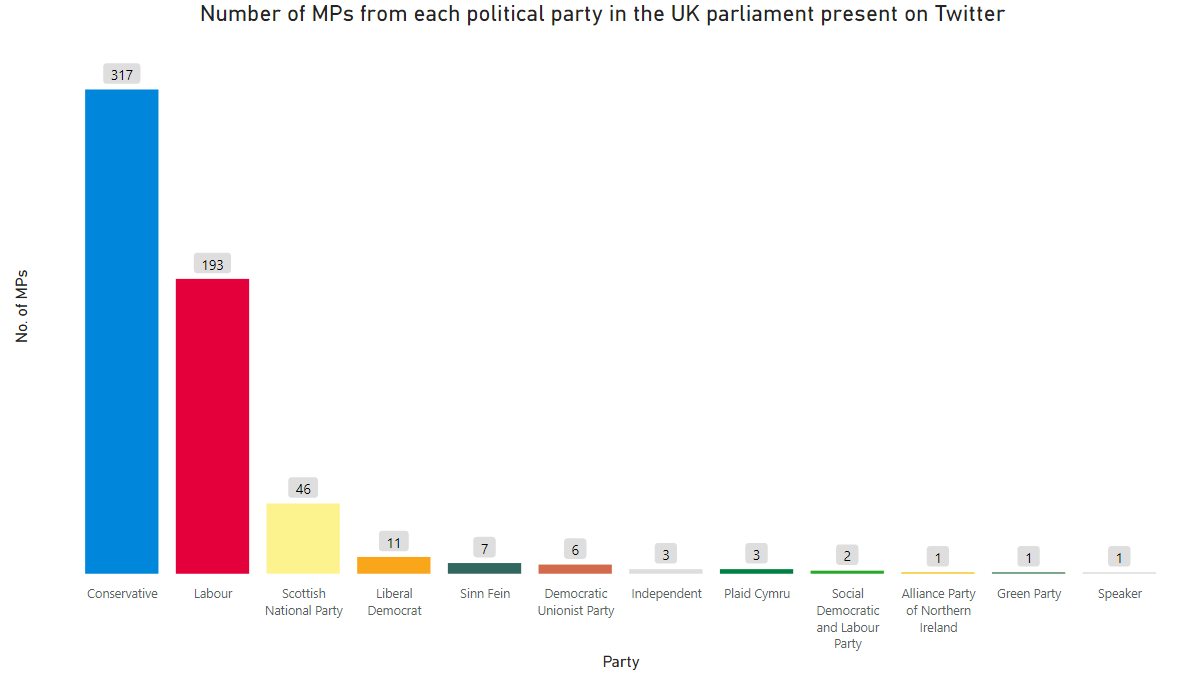
With 317 Conservative MPs present on Twitter, the Conservative Party is the biggest party on Twitter, just as it is in the parliament. With this in mind, it is technically possible that if all Conservative MPs followed only each other, they would all have 316 MP followers each and they would all be in the top 10, top 30 or even top 100 most followed among all MPs. And the fact that is not the case is somewhat surprising. Nonetheless, here we see that the problems of the UK’s electoral system are also reflected in the realm of Twitter. Those at the top hold a disproportionate amount of power. In last general election, the Conservative Party won only 43.6% of the popular vote (meaning that more than a half of the UK population voted for a party other than the Conservatives), and yet it has a strong majority in the parliament and can make decisions without much involvement of the opposition parties. Similarly, on the Twitter, the Conservative MPs represent only 53.64% of all MPs present on Twitter, and yet, in the top 30 most followed MPs among MPs, 83% are Conservatives and in the top 50, the number drops, but not significantly, to 78%.
Such situation is concerning. When a party in the parliament is as numerous as the Conservative Party, it is able to segregate itself from the rest of the political parties. This is problematic as when the party also holds a disproportionate amount of power, the party then also has no necessity to seek opinions from the outside and to seek understanding and compromise. It is able to create a discourse and narrative based on self-interest and party-preservation and it is then able to create public policies based on such ideas and impose those policies on the rest of the parties, and the country.
I found that the above is not only a hypothetical situation, but it also occurs in practice. The Conservative Party MPs, but also the Labour and SNP MPs, segregate themselves into their own party bubbles on Twitter.
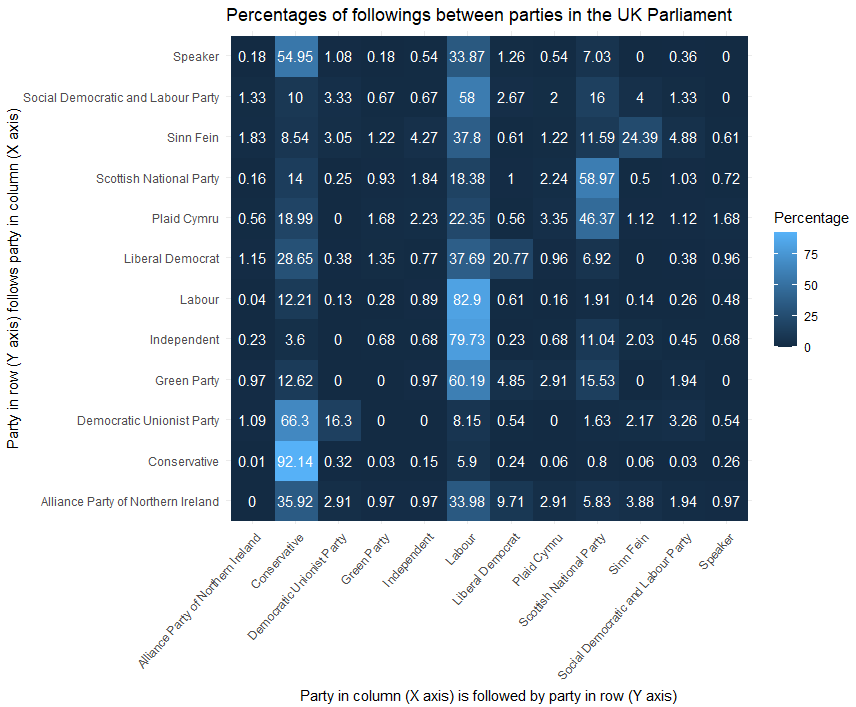
To create the heatmap, all the MPs present on Twitter and their individual ‘followings’ (other MPs accounts that they follow) were grouped into political party groups and summed up. The visualisation then looks at the percentage that different political groups represent of a particular group’s total ‘followings’. For example, the ‘Speaker’ row, at the top of the Y axis, looks at all the followings of the Speaker. The first two values in this row are 0.18% and 54.95% and these values are in the columns of the Alliance Party of Northern Ireland (APNI) and the Conservative Party. This means that out of all the MPs followed by the Speaker 0.18% are APNI MPs and 54.95% are Conservative MPs.
To provide a little more context for comparison, out all of 591 MPs present on Twitter, each party’s MPs represent the following percentages: Conservative - 53.64%, Labour - 32.66%, Scottish National Party - 7.78%, Liberal Democrat - 1.86%, Sinn Fein - 1.18%, Democratic Unionist Party - 1.02%, Plaid Cymru - 0.51%, Social Democratic and Labour Party - 0.34%, Green Party - 0.17%, Alliance Party of Northern Ireland - 0.17%, Speaker - 0.17% and the Independent MPs represent 0.51%.
With this context in mind, we see that followings of the Speaker are quite representative and reflective of the actual makeup of the Westminster Twittersphere, with the only, but major, difference being the lack of followings for any of the Sinn Fein MPs. However, that is where any semblance of the actual representativeness ends. All other political groups show bias in whom they follow, with the seriousness of the issue increasing proportionately with the number of MPs that a particular party has on Twitter. Thus, the Conservative Party and its MPs are the biggest offenders here. Not only is the Conservative Party the largest party on Twitter, but it is also the most ‘closed off’ and the least diverse. Out of the total followings of the Conservative MPs, 92.14% are other Conservative MPs. While, the Labour MPs, who make up the 2nd largest party on Twitter, represent only 5.9% of the Conservative Party’s total followings. To say that this situation is worrisome would be an understatement. However, the Labour Party and its MPs are not much better. Out of the Labour Party’s total followings, 82.9% are Labour MPs, while only 12.21% are Conservative. And although Labour MPs follow Conservative MPs over twice as much as the other way around, it could be just a case of Labour being the opposition party and needing to follow to Conservative MPs more attentively and it is possible that if in power, the Labour Party would be just as ‘closed off’ as the Conservative Party. Moreover, the issue also extends to the SNP, whose MPs also show a large preference in following in each other, over following other parties' MPs. Out of SNP’s total followings, 58.97% are fellow SNP MPs, 18.38% are Labour MPs and 14% are Conservative MPs.
Based on these percentages, we can see that the MPs from the 3 biggest parties in the UK parliament close themselves in their own party bubbles. To further emphasize my point, I will show how these percentages would be represented as actual followings on Twitter.
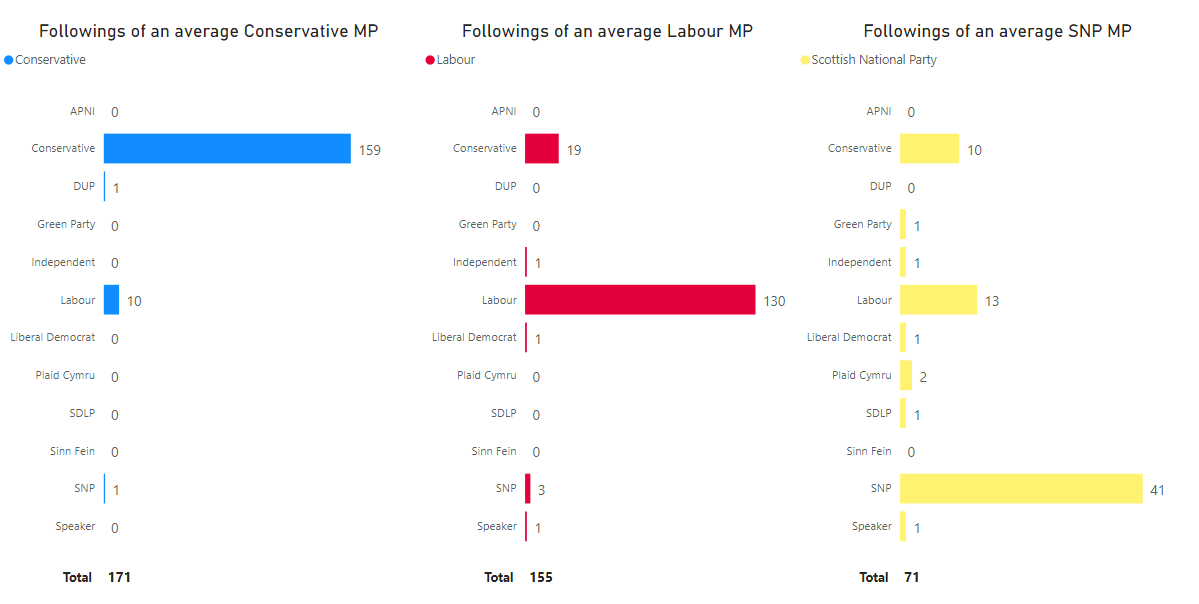
The above charts sum up all the followings of MPs from the Conservative Party, the Labour Party and the SNP and divide the results by the number of MPs from each party present on Twitter, giving the followings for an average MP from those parties. And the resulting numbers show just how serious the issue is, especially among within the Conservative Party. An ‘average’ Conservative MP follows 171 other MPs, but out of those, 159 are fellow Conservative MPs, 10 are Labour MPs, and there is 1 MP each being followed from the DUP and the SNP. This puts into the perspective the lack of interest from Conservative MPs in MPs from other parties, which is then also a lack of interest in the constituencies whose MPs do not belong to the Conservative Party. The ‘average’ Labour MP is slightly better, as this MP follows nearly twice as many Conservative MPs, 2 more SNP MPs and even 1 MP from the Liberal Democrats. However, the followings of the ‘average’ SNP MP are the most diverse out of the 3, as this MP also follows 1 MP from the Green Party, 2 MPs from Plaid Cymru and 1 MP from the SDLP. This increased diversity should not go unnoticed as these 3 parties are not followed by the ‘average’ Conservative and Labour MPs and when we look at the 2019 General Elections, these 3 parties (and its MPs) represent the interests of over 1 million voters in the UK.
Moreover, something that is of importance, but is not highlighted in the previous analyses, are the MPs, who are the least followed among other MPs. Analysing this piece of information allows to get a better idea of the larger picture as when we look only at those at top, we see whose voice matters the most, but by looking at those at the bottom, we see whose voice matters the least. It is necessary to remember that the concepts of ‘exclusion’ and ‘inclusion’ play a significant role in modern politics.
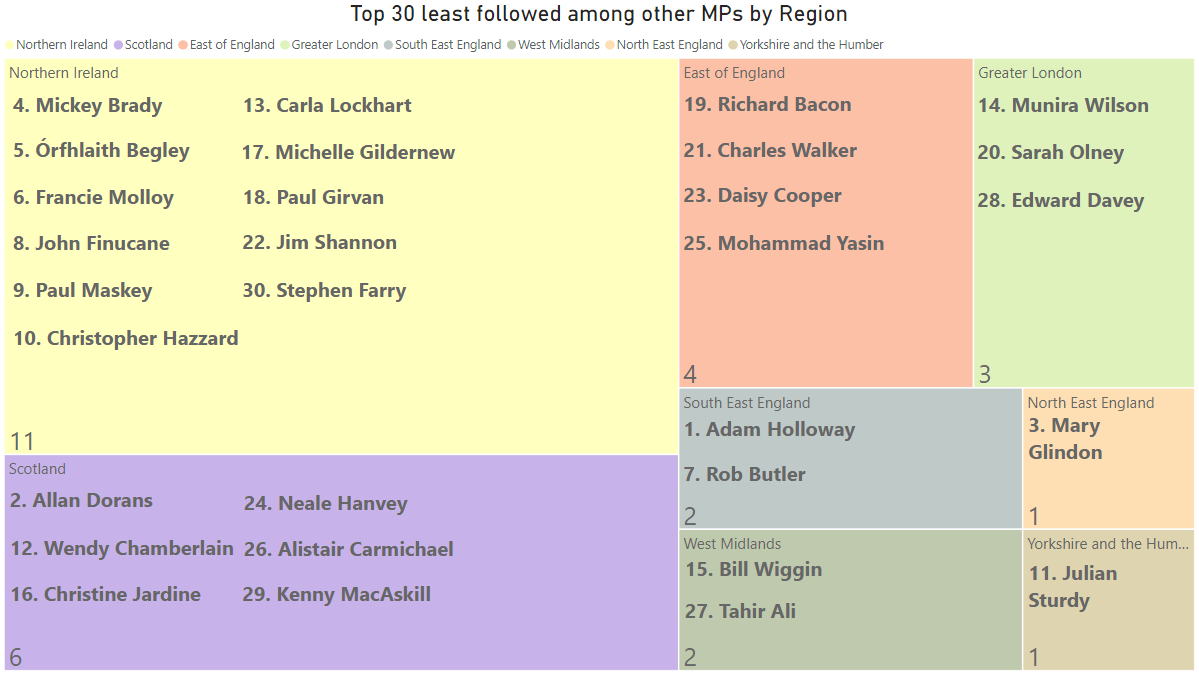
In the above chart, there is a similar pattern to the charts before, as here also, it is the Northern Irish and the Scottish MPs, in whom other MPs display the least interest as MPs from these two nations represent over 50% of the 30 least followed MPs. Moreover, when looking at the party-belonging of these MPs, 21 out of 30 (70%) do not belong to neither the Conservative nor the Labour parties. Again, this only highlights the lack of interest in the voices of MPs and the issues of the constituencies, who do not belong to the two biggest parties. And just to further prove the point, the situation does not improve when looking at the top 50 least followed. It actually worsens. Out of the top 50 least followed MPs, 36 MPs (72%) do not belong to the Conservative nor the Labour parties.
Conclusion
Throughout this analysis, we can see a familiar pattern emerge. The bigger the party and the more MPs it has on Twitter, the more ‘closed off’ and less diverse it is in its followings. We see this problem being the most serious within the Conservative Party. This party has the most MPs on Twitter, it dominates the top 30 and 50 most followed, but it is also the most ‘closed off’, where 92.14% of its followings are of fellow Conservative MPs. The situation improves as we go down the list of largest parties, with 82.9% of Labour followings being of fellow Labour MPs and 58.97% of SNP followings being of fellow SNP MPs. Nevertheless, within these three largest parties, we see the existence of party bubbles. Moreover, we also see the exclusion of minority party and opposition voices. The Conservative and Labour MPs dominate the ‘most followed’ table, however the MPs from outside of these two parties, dominate the ‘least followed’ table, with around 70-72% of the MPs in the top 30 and top 50 ‘least followed’ MPs not belonging to neither the Conservative nor the Labour parties.
As Twitter becomes an increasingly important part of MPs’ lives, this situation has the potential to be worrying. The existence of party bubbles is dangerous for democracy as when MPs ‘close’ themselves in their party bubbles, they receive information from a reduced diversity of sources, meaning that the information is of lower quality, which then creates an ideal environment for the erosion of civil discourse. Although my analysis will not solve this problem, it is important to first acknowledge the problem and learn its true extent before trying to solve it. And to further learn about the extent of the problem, future analyses should expand their scope from focusing only on the ‘following’, to also including analyses of the actual interactions between MPs (e.g. the ‘likes’ and ‘retweets’). Additionally, there should future yearly analyses of these trends on Twitter, to monitor whether the situation is improving or worsening.
Methodology
I downloaded the list of MPs present on Twitter from Politics Social and I made a few adjustments to the list. To collect the data about the MPs' ‘followings’ on Twitter, I used R/RStudio and the Rtweet package. I then created the visualisations using a combination of R and Power BI.
Moreover, for those who would like to have a look at the data, below I include an interactive table with all the MPs I used in my analysis, the number of their followers and followings, the twitter name, party, constituency and the region to which their constituency belongs.